The data you need.100% uptime delivered.

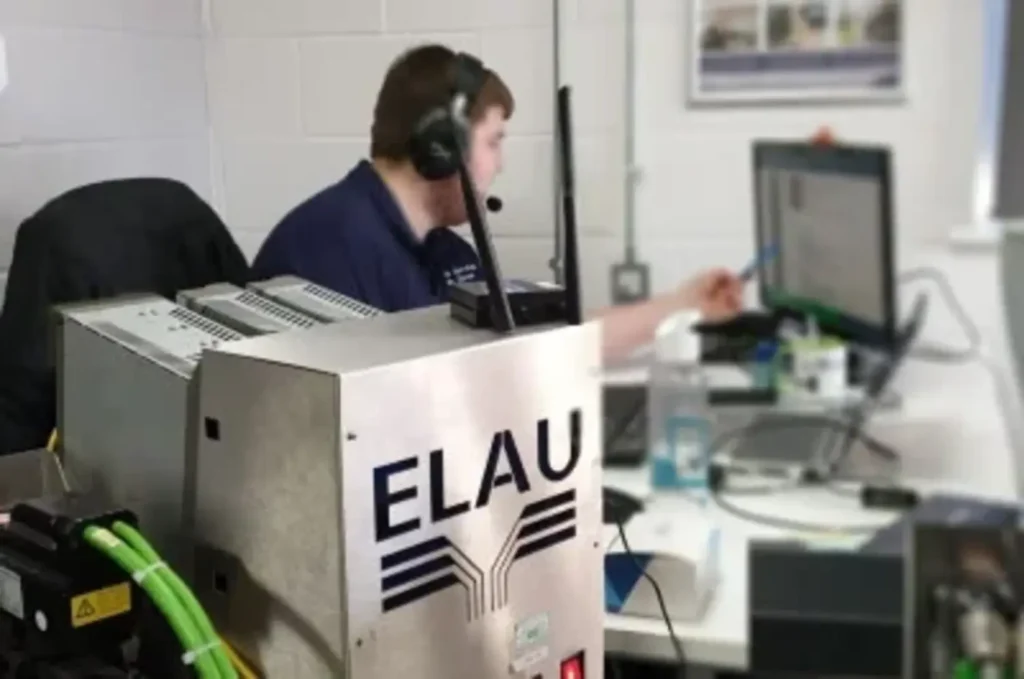
ELAU PacDrive diagnostic tool for engineering managers – total site visibility and condition-based maintenance.

Stop managing by gut feel. Get a live dashboard of every ELAU PacDrive machine on your site – from anywhere, at any time.

Total site visibility from one dashboard
Condition-based maintenance planning
Cloud or fully offline – your infrastructure, your rules
Automated ROI and uptime reporting

Three things every engineering manager
struggles with. Until now.

You’re judged on uptime. Held accountable for costs. Expected to have answers when things go wrong. The problem is most managers are working blind – reacting to problems instead of seeing them coming.

Problem 1 — Visibility
No visibility until it’s too late

You find out about breakdowns when the line stops – not before. By then your engineer is searching logs, your schedule is slipping and the cost clock is running.

Problem 2 — Maintenance
Maintenance driven by calendars, not condition

Fixed schedules waste time on equipment that’s fine and miss equipment that’s deteriorating. Without wear data, you can’t know what needs attention – until it fails.

Problem 3 — Reporting
No data to justify decisions upward 

Budget requests, headcount, equipment investment – all harder without measurable KPIs. When leadership asks why the line stopped again, you need evidence, not estimates.

Five things Machine Analyser® gives
every engineering manager.

Your engineers have the real-time tools for breakdowns. Your stores have risk items, missing parts and a parts compatibility analyser. Your PACs have all the data. Machine Analyser® pulls it all together – so you can see everything, plan smarter and stop being the last to know. No sensors, no lengthy IT project, live in under a day.

Site-Wide Visibility, Anywhere.

Monitor every machine and line via a secure cloud dashboard. Access real-time health data from any location and eliminate the wait for manual downtime briefings.

Total Production Visibility: Real-time health for all lines
Any-Device Access: Secure monitoring on any device
Multi-Site Oversight: Centralised data for all locations
Instant Performance KPIs: Shift-by-shift status at a glance

Production Patterns & Machine Behaviour

Correlate production intensity with equipment behaviour. Identify if weekend surges or specific shift outputs are driving fault rates, allowing you to intervene before patterns become breakdowns.

Peak Correlation: Map production surges against fault frequency
Shift Profiling: Spot error patterns unique to specific shifts
Conditional Logic: Identify faults triggered only under heavy loads
Data-Driven Planning: Use behavioural data to optimise production schedules

Condition-Based Maintenance Planning

Move from calendar-driven schedules to data-backed decisions. Track real wear trends so your team services what actually needs attention during planned windows - not during emergencies.

Wear Tracking: Live usage data for every critical site asset
Condition-Based Windows: Schedule repairs based on actual machine health
Zero-Waste Servicing: Eliminate maintenance on healthy equipment
Early Warnings: Automated alerts at the first sign of deterioration

Asset Health, Obsolescence & Risk

Maintain a live registry of every drive, motor, and controller. Identify aging components and obsolete hardware before they fail, ensuring your stores team stocks the right parts for your highest-risk assets.

Unified Asset Registry: Full visibility of every site component
Obsolescence Flagging: Identify EOL hardware and lifecycle risks
Firmware Auditing: Track versioning across all equipment
Strategic Spares: Link stores planning directly to asset risk data

Reports & ROI You Can Present

Transform complex PAC data into clear evidence of progress. Use automated reports to justify investments, advocate for headcount, and demonstrate downtime reduction to leadership - no data analyst required.

Trend Analytics: Track downtime frequency and severity over time
Management Dashboards: KPI-focused views built for leadership review
Performance Benchmarking: Clear year-over-year improvement comparisons
Evidence-Based Justification: Hard data for budget and resource requests

The numbers that keep managers up at night.

Industry research and the reality we see every day on the factory floor.

£40K

The real cost of every single hour of unplanned downtime in manufacturing

81 min

Average incident duration – up from 49 minutes recorded just five years ago

12 hrs

Potential cost reduction from condition-based maintenance

9/10

Manufacturers want condition monitoring but most still don’t have it

How managers use
Machine Analyser® every day.

From the morning shift review to the board meeting – Machine Analyser fits into how you already work.

  • Morning Shift Review

    Start every day knowing exactly what happened overnight

    Log in and see a full summary of what happened across every line during the previous shift - faults, alerts, error trends, resets and anomalies. No waiting for the handover briefing. No surprises when you walk the floor. A complete picture before you've left the car park.

  • Shift Pattern Analysis

    Spot patterns in when faults happen - and why

    Machine Analyser® logs every fault, reset and error event with a timestamp. Over time, patterns emerge - certain faults that only appear on certain shifts, repeated error resets with no proper resolution, or recurring issues that correlate with specific production runs. This data helps you identify where process gaps exist and have informed conversations with your team about how breakdowns are being handled.

  • Maintenance Window Planning

    Schedule maintenance around data, not dates

    Use wear trends and usage data to plan your next maintenance window around the machines that actually need attention. Stop spending time and budget on equipment that's running fine - and stop missing the ones that aren't. Every planned window is based on evidence, not a fixed calendar.

  • Obsolescence & Risk Planning

    Know which assets are ageing and what that means for your operation

    Machine Analyser® flags components that are approaching end of life, already obsolete or showing deterioration trends. Work with your stores manager to ensure the right spares are on the shelf before a critical component fails - not after. Knowing your risk profile across the site gives you time to plan, budget and act rather than react.

  • Breakdown Debrief

    Understand what happened, why it happened and how to prevent the next one

    After a breakdown, Machine Analyser® gives you the full picture - the fault, the preceding events, the error history and the resolution timeline. Use this in your debrief to identify root causes, update your maintenance approach and demonstrate to leadership what was learned and what's changed.

  • Budget & Investment Justification

    Turn downtime data into a business case

    When you need to justify headcount, equipment investment or maintenance budget, Machine Analyser® gives you the numbers - downtime frequency, trends and improvement over time. Clear, exportable data that makes the conversation with finance and senior management straightforward. Stop asking for budget based on instinct. Start asking with evidence.

  • Multi-Site Oversight

    One view across every site you're responsible for

    If you manage multiple sites or production lines, Machine Analyser® gives you a single dashboard view of equipment health across all of them - accessible from anywhere. Benchmark performance between sites, identify where problems are recurring and direct resources where they're needed most, without needing to be on-site to know what's going on.

What managers say
about Machine Analyser®

Machine Analyser has completely changed how we respond to breakdowns. What used to take hours of PAC searching now takes minutes. We identified a recurring drive fault pattern we'd never spotted before.

Site Engineering Manager

Production Manufacturing

The ROI was clear within the first month. One prevented breakdown more than paid for a year of the subscription. The finance case writes itself - measurable results from day one.

Operations Director
Operations Director

Healthcare Manufacturing

Your site is generating data right now.
Are you using it?

Your engineers react. Your stores order parts. Your senior team asks questions.
Machine Analyser gives you the data to stay ahead of all three.

Launch login modal Launch register modal