No sensors.
No hardware.Your PAC ALREADY has THE DATA.
ELAU PacDrive diagnostic tool — No sensors. No hardware. The data your PAC already has.
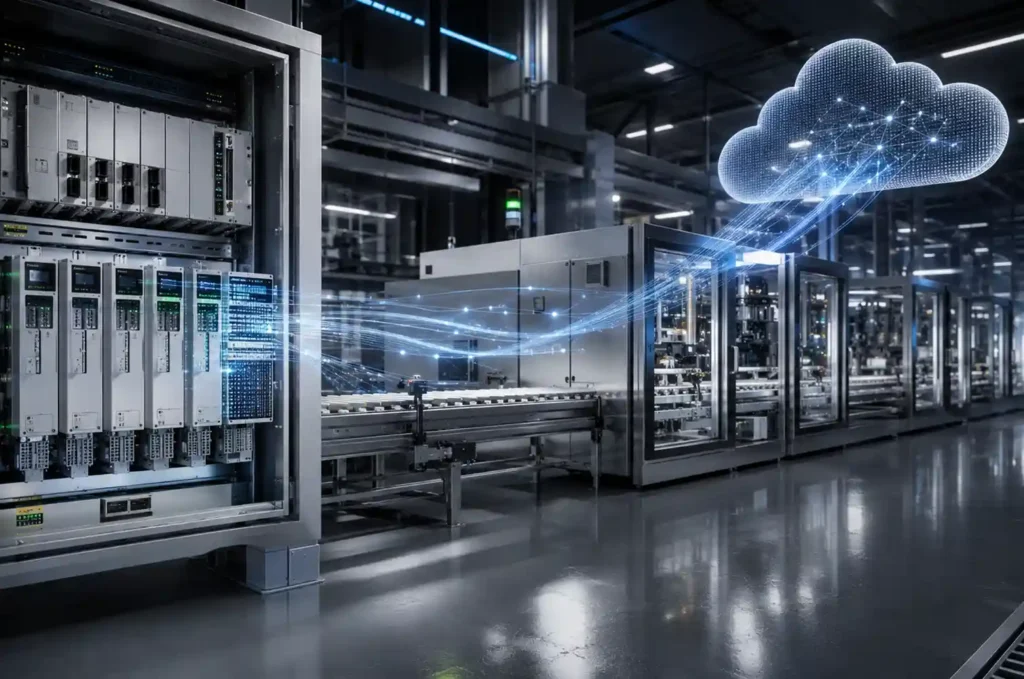
Machine Analyser® connects directly to your ELAU PacDrive – no sensors, no hardware, no disruption. Root cause, remedy and machine health straight to your browser.
✓ No sensors – ever
✓ Zero risk – read-only connection
✓ Live insights from day one
✓ Cloud or 100% offline
Your production line
Machine Analyser®
Deployment options
On-Premise
Data stays
on-site
on-site
OR
Cloud
Azure-hosted
analytics
analytics
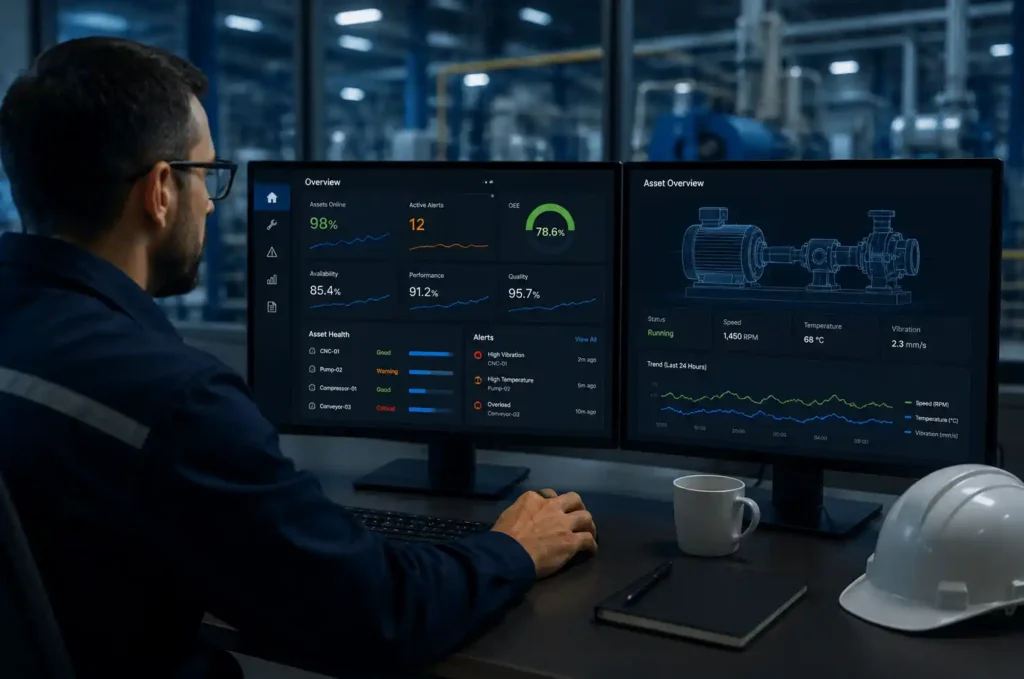
Who benefits
Engineers
Faster fault diagnosis
Site Managers
Production visibility
Maintenance
Condition monitoring
Stores Managers
Parts & spares intel
Any device
Browser · same network